Skip to content
Facebook-f Linkedin-in Instagram
User-alt

Market Status: 

Closed

05 Nov 2026 21:37 PM

View Live Liquidity Summaries
Search
Facebook-f Linkedin-in Instagram
User-alt

Market Status: 

Closed

05 Nov 2026 21:37 PM

View Live Liquidity Summaries
Caribbean Exchange Index 28 Sep 2026: CXNI  1012.07 (1.41) | TTSE Index Summary for 29 Sep 2026: COMPOSITE 1018.98 (2.76) | ALL T&T 1448.45 (5.38) | CROSS-LISTED 78.38 (-0.01) | SME 74.69 (0.00) | Market Summary for 05 Nov 2026 @ 12:05 PM: AGL Vol 14,671 $44.64 (2.36) | AHL Vol 0 $10.37 (0.00) | AMBL Vol 0 $25.00 (0.00) | AMCL Vol 14,586 $45.00 (3.00) | ASBH Vol 9,111 $1.05 (-0.10) | ASBH6.00 Vol 0 $1.00 (0.00) | CIBC Vol 12,625 $8.09 (-0.06) | CINE1 Vol 0 $1.98 (0.00) | CPFD Vol 0 $0.71 (0.00) | CPFV Vol 0 $1.60 (0.00) | EHL Vol 209 $12.75 (0.05) | FCGFH Vol 3,371 $37.00 (-0.50) | GHL Vol 0 $17.15 (0.00) | GKC Vol 17,500 $3.22 (-0.48) | GML Vol 0 $0.75 (0.00) | GMLP Vol 0 $65.85 (0.00) | JMMBGL Vol 30 $0.87 (0.00) | LJWA Vol 0 $0.22 (0.00) | LJWB Vol 0 $0.86 (0.00) | LJWP Vol 0 $3.79 (0.00) | MASSY Vol 6,891 $3.28 (-0.01) | MED Vol 2,173 $39.97 (-3.78) | MPCCEL Vol 0 $0.98 (0.00) | NCBFG Vol 10 $3.25 (0.00) | NEL Vol 103,497 $5.40 (-0.02) | NFM Vol 17,378 $1.55 (-0.05) | NGL Vol 0 $9.98 (0.00) | OCM Vol 0 $1.50 (0.00) | PHL Vol 157 $12.00 (0.00) | PLD Vol 1,091 $7.25 (-0.06) | RFHL Vol 3,817 $113.85 (0.41) | SBTT Vol 25 $48.48 (0.00) | SOLIS Vol 0 $4.85 (0.00) | TCL Vol 1,266 $1.75 (-0.24) | UCL Vol 0 $15.25 (0.00) | WCO Vol 8,068 $3.85 (0.00) | WIT Vol 0 $2.07 (0.00) |
            Array
(
    [0] => stdClass Object
        (
            [IndexCode] => COMPOSITE
            [IndexId] => 5
            [ClosingPrice] => 1018.98
            [IndexPriceChange] => 2.7600000
            [MarketCapital] => 99820032791.410
            [ValueDate] => 2026-09-29 00:00:00
        )

    [1] => stdClass Object
        (
            [IndexCode] => ALL T&T
            [IndexId] => 4
            [ClosingPrice] => 1448.45
            [IndexPriceChange] => 5.3800000
            [MarketCapital] => 73869571444.760
            [ValueDate] => 2026-09-29 00:00:00
        )

    [2] => stdClass Object
        (
            [IndexCode] => CROSS-LISTED
            [IndexId] => 6
            [ClosingPrice] => 78.38
            [IndexPriceChange] => -0.0100000
            [MarketCapital] => 25950461346.650
            [ValueDate] => 2026-09-29 00:00:00
        )

    [3] => stdClass Object
        (
            [IndexCode] => SME
            [IndexId] => 15
            [ClosingPrice] => 74.69
            [IndexPriceChange] => 0.0000000
            [MarketCapital] => 877199107.810
            [ValueDate] => 2026-09-29 00:00:00
        )

)
        
Index Summary for 29 Sep 2026: COMPOSITE 1018.98 (2.76) | ALL T&T 1448.45 (5.38) | CROSS-LISTED 78.38 (-0.01) | SME 74.69 (0.00) | Market Summary for 05 Nov 2026 @ 12:05 PM: AGL Vol 14,671 $44.64 (2.36) | AHL Vol 0 $10.37 (0.00) | AMBL Vol 0 $25.00 (0.00) | AMCL Vol 14,586 $45.00 (3.00) | ASBH Vol 9,111 $1.05 (-0.10) | ASBH6.00 Vol 0 $1.00 (0.00) | CIBC Vol 12,625 $8.09 (-0.06) | CINE1 Vol 0 $1.98 (0.00) | CPFD Vol 0 $0.71 (0.00) | CPFV Vol 0 $1.60 (0.00) | EHL Vol 209 $12.75 (0.05) | FCGFH Vol 3,371 $37.00 (-0.50) | GHL Vol 0 $17.15 (0.00) | GKC Vol 17,500 $3.22 (-0.48) | GML Vol 0 $0.75 (0.00) | GMLP Vol 0 $65.85 (0.00) | JMMBGL Vol 30 $0.87 (0.00) | LJWA Vol 0 $0.22 (0.00) | LJWB Vol 0 $0.86 (0.00) | LJWP Vol 0 $3.79 (0.00) | MASSY Vol 6,891 $3.28 (-0.01) | MED Vol 2,173 $39.97 (-3.78) | MPCCEL Vol 0 $0.98 (0.00) | NCBFG Vol 10 $3.25 (0.00) | NEL Vol 103,497 $5.40 (-0.02) | NFM Vol 17,378 $1.55 (-0.05) | NGL Vol 0 $9.98 (0.00) | OCM Vol 0 $1.50 (0.00) | PHL Vol 157 $12.00 (0.00) | PLD Vol 1,091 $7.25 (-0.06) | RFHL Vol 3,817 $113.85 (0.41) | SBTT Vol 25 $48.48 (0.00) | SOLIS Vol 0 $4.85 (0.00) | TCL Vol 1,266 $1.75 (-0.24) | UCL Vol 0 $15.25 (0.00) | WCO Vol 8,068 $3.85 (0.00) | WIT Vol 0 $2.07 (0.00) |
Menu
  • Home
  • Investing
    • Subscriptions
      • Trading Reports
      • Trading System
    • Ready to Invest
    • Glossary of Investment Terms
  • Investor Education
  • SME Market
    • Listing Requirements
    • TTSE SME Market – Executive Guide
    • SME Mentorship Programme
      • SME Mentorship Programme
      • List Of SME Mentors
  • Rules
  • GSS+ Guidelines
  • Market Data
    • Indices
    • Reports & Summaries
    • Market Movement Report
  • Issuers
    • Listed Securities
    • Going Public
      • Listing your company on the TTSE
      • Listing on the First & Second Tier Markets
      • Listing on the Small & Medium Enterprise Markets
      • Listing on the Mutual Fund Markets
      • Listing on the Government & Corporate Bond Markets
      • Listing & Other Fees
      • Benefits of Listing
  • Media Centre
    • Newsroom
    • TTSE News
    • Events
    • Capital Markets Conference 2025
    • Capital Markets Conference 2024
    • Related Websites
    • Brochures
    • FAQ
    • COVID-19 Updates
    • Prospectus and Offer Circulars
    • Document Centre
  • Member Firms
    • Opening a Brokerage Account
    • Equities, Mutual Funds and Corporate Bonds
    • Government Bonds
    • CXN
  • Register
    • Trader Registration
    • Stockbroker Registration
    • Member Registration
    • Online Trading Registration
    • TTCD Portal
  • TTCD
    • About TTCD
    • TTCD Fees
    • Procedures
    • Euroclear Custody
    • Registrar Services
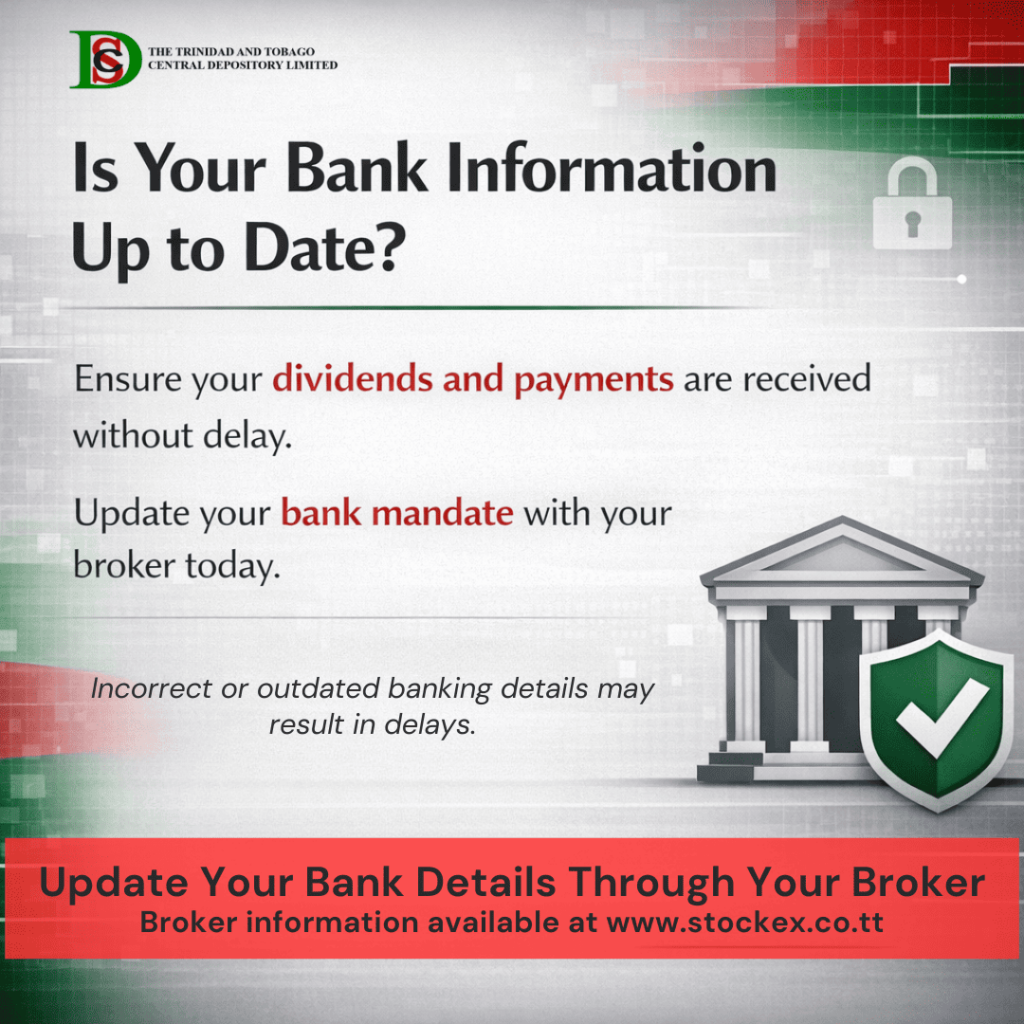
    • TTCD Bank Mandate
    • FATCA
    • Shareholders
    • TTCD Forms
  • About
    • History
    • Mission and Vision
    • Governance
    • Who We Are
    • Corporate Profile
    • Careers
    • Annual Reports
    • Trading
    • TTSE Fees
    • Contact
      • Feedback
Menu
  • Home
  • Investing
    • Subscriptions
      • Trading Reports
      • Trading System
    • Ready to Invest
    • Glossary of Investment Terms
  • Investor Education
  • SME Market
    • Listing Requirements
    • TTSE SME Market – Executive Guide
    • SME Mentorship Programme
      • SME Mentorship Programme
      • List Of SME Mentors
  • Rules
  • GSS+ Guidelines
  • Market Data
    • Indices
    • Reports & Summaries
    • Market Movement Report
  • Issuers
    • Listed Securities
    • Going Public
      • Listing your company on the TTSE
      • Listing on the First & Second Tier Markets
      • Listing on the Small & Medium Enterprise Markets
      • Listing on the Mutual Fund Markets
      • Listing on the Government & Corporate Bond Markets
      • Listing & Other Fees
      • Benefits of Listing
  • Media Centre
    • Newsroom
    • TTSE News
    • Events
    • Capital Markets Conference 2025
    • Capital Markets Conference 2024
    • Related Websites
    • Brochures
    • FAQ
    • COVID-19 Updates
    • Prospectus and Offer Circulars
    • Document Centre
  • Member Firms
    • Opening a Brokerage Account
    • Equities, Mutual Funds and Corporate Bonds
    • Government Bonds
    • CXN
  • Register
    • Trader Registration
    • Stockbroker Registration
    • Member Registration
    • Online Trading Registration
    • TTCD Portal
  • TTCD
    • About TTCD
    • TTCD Fees
    • Procedures
    • Euroclear Custody
    • Registrar Services
    • TTCD Bank Mandate
    • FATCA
    • Shareholders
    • TTCD Forms
  • About
    • History
    • Mission and Vision
    • Governance
    • Who We Are
    • Corporate Profile
    • Careers
    • Annual Reports
    • Trading
    • TTSE Fees
    • Contact
      • Feedback

Daily Values and Index Summary

Click here to return to Reports & Summaries

Kindly select a date from the calendar below, then press the ‘go’ button to view the trading reports and summaries for the chosen date.

Daily Values and Index Summary for Tuesday, 29 Sep, 2026

Capitalisation Value Trades Traded Volume Traded Value Index Change Change %
COMPOSITE Totals 99,820,032,791 145 393,243 5,477,722.91 1,018.98 2.76 0.27
ALL T&T Totals 73,869,571,445 127 185,039 3,834,705.93 1,448.45 5.38 0.37
CROSS-LISTED Totals 25,950,461,347 18 208,204 1,643,016.98 78.38 -0.01 -0.01
SME Totals 877,199,108 2 21 86.33 74.69 – –
NON SECTOR Totals 12,258,646 – – –
TTD Equity

Security Issued Share Capital Capitalisation Value Trades Traded Volume Traded Value Index Change Change %
CIBC 1,577,094,570 12,616,756,560 4 204,011 1,631,643.49  
FCGFH 251,353,562 10,109,440,264 14 9,221 370,823.27  
NCBFG 2,545,325,512 7,508,710,260 1 3 9.69  
RFHL 163,923,916 18,525,041,747 9 23,924 2,703,637.00  
SBTT 176,343,750 8,393,962,500 4 600 28,561.89  
BANKING Sector Totals 4,714,041,310 57,153,911,331 32 237,759 4,734,675.34 883.28 3.29 0.37

Security Issued Share Capital Capitalisation Value Trades Traded Volume Traded Value Index Change Change %
AMCL 176,197,617 7,927,130,789 6 634 28,523.66  
GKC 988,941,759 4,104,108,300 5 2,345 9,731.75  
MASSY 1,979,384,540 6,710,113,591 34 57,808 196,142.42  
CONGLOMERATES Sector Totals 3,144,523,916 18,741,352,679 45 60,787 234,397.83 2,753.66 -3.17 -0.11

Security Issued Share Capital Capitalisation Value Trades Traded Volume Traded Value Index Change Change %
PLD 39,625,684 297,192,630 2 143 1,072.50  
PROPERTY Sector Totals 39,625,684 297,192,630 2 143 1,072.50 313.08 0.00 0.00

Security Issued Share Capital Capitalisation Value Trades Traded Volume Traded Value Index Change Change %
AHL 205,820,361 2,196,103,252 2 109 1,163.03  
GML 40,000,000 34,000,000 – – –  
NFM 120,200,000 204,340,000 7 28,731 48,842.70  
OCM 66,499,801 111,719,666 3 5,040 8,469.20  
UCL 26,243,832 400,480,876 6 5,915 90,265.00  
WCO 252,720,000 1,048,788,000 6 6,778 28,128.70  
MANUFACTURING I Sector Totals 711,483,994 3,995,431,794 24 46,573 176,868.63 658.18 1.40 0.21

Security Issued Share Capital Capitalisation Value Trades Traded Volume Traded Value Index Change Change %
TCL 374,647,704 745,548,931 5 20,191 40,236.41  
MANUFACTURING II Sector Totals 374,647,704 745,548,931 5 20,191 40,236.41 230.02 9.25 4.19

Security Issued Share Capital Capitalisation Value Trades Traded Volume Traded Value Index Change Change %
AGL 81,711,898 3,958,941,458 5 168 8,276.60  
ASBH 1,499,251,189 2,248,876,784 4 167 240.75  
LJWB 19,742,074 12,832,348 – – –  
PHL 62,513,002 718,899,523 1 5 60.00  
TRADING Sector Totals 1,663,218,163 6,939,550,113 10 340 8,577.35 425.51 0.00 0.00

Security Issued Share Capital Capitalisation Value Trades Traded Volume Traded Value Index Change Change %
NGL 116,100,000 1,200,474,000 10 20,885 215,856.25  
ENERGY Sector Totals 116,100,000 1,200,474,000 10 20,885 215,856.25 51.70 0.45 0.88

Security Issued Share Capital Capitalisation Value Trades Traded Volume Traded Value Index Change Change %
AMBL 85,605,263 2,414,068,417 3 695 19,599.55  
GHL 232,024,923 3,851,613,722 4 2,191 36,370.60  
JMMBGL 1,955,552,530 1,720,886,226 8 1,845 1,632.05  
NEL 600,000,641 2,760,002,949 2 1,834 8,436.40  
NON-BANKING FINANCE Sector Totals 2,873,183,357 10,746,571,313 17 6,565 66,038.60 750.27 2.11 0.28

Security Issued Share Capital Capitalisation Value Trades Traded Volume Traded Value Index Change Change %
GMLP 29,297 1,929,207 – – –  
LJWA 46,166,600 10,156,652 – – –  
LJWP 45,590 172,786 – – –  
NON-SECTOR Sector Totals 46,241,487 12,258,646 – – –

Security Issued Share Capital Capitalisation Value Trades Traded Volume Traded Value Index Change Change %
MOV (S) 8,255,000 99,060,000 – – –      
Second-Tier Totals 8,255,000 99,060,000 – – –      

SME Market

Security Issued Share Capital Capitalisation Value Trades Traded Volume Traded Value Index Change Change %
CINE1 8,007,869 27,066,597 – – –      
EHL 32,887,619 419,646,018 – – –      
MED 7,829,977 342,561,494 1 1 43.73      
SOLIS 8,333,333 39,999,998 – – –      
WIT 22,500,000 47,925,000 1 20 42.60      
SME Totals 79,558,798 877,199,108 2 21 86.33 74.69 0.00 0.00

TTD Mutual Fund

Security Issued Share Capital Capitalisation Value Trades Traded Volume Traded Value Index Change Change %
CALYP (S) 20,200,000 505,000,000 – – –      
CPFD 54,944,803 39,010,810 – – –      
CPFV 55,652,768 89,044,429 – – –      
Mutual Funds Totals 130,797,571 633,055,239 – – –      

USD Equity

Security Issued Share Capital Capitalisation Value Trades Traded Volume Traded Value Index Change Change %
ASBH6.00 30,403,000 30,403,000 – – –      
MPCCEL 36,944,861 36,205,964 – – –      
USD Equity Totals 67,347,861 66,608,964 – – –      

Please be advised that the security name and symbol for FirstCaribbean International Bank Limited (FCI) has been changed on the Trinidad and Tobago Stock Exchange to CIBC Caribbean Bank Limited (CIBC) effective November 07th, 2024.

The Composite Index is calculated using the Ordinary Shares of all Listed Companies, excluding
securities categorised as Non-Sector.

The All T&T Index is calculated using the Ordinary Shares of whose primary jurisdiction is Trinidad
& Tobago, excluding securities categorised as Non-Sector.

The Cross Listed Index is calculated using the Ordinary Shares of foreign Companies ONLY.

(XD)Ex-Dividend(XR)Ex-Rights(XC)Ex-Capitalization(S)Suspended

By default the following buttons will open reports for the latest trading date available.

Daily Market Quote
Daily Written Report
Bond Summaries

Equities

View latest activity

Bonds

View latest activity

Mutual Funds

View latest activity

USD

View latest activity

INVESTING

Menu
  • Subscriptions
    • Subscribe – Trading Reports
    • Subscribe – Trading System
  • Ready to Invest
  • Glossary of Investment Terms
TOP Logo

Online Trading

Subscribe to TTSE Trading System

Subscribe

TTSE E-Statements

TTCD Portal

TTSE Reports and Summaries

Reports & Summaries

TOP Logo

Online Trading

Subscribe to TTSE Trading System

Subscribe

TTSE E-Statements

E-Statements

TTSE Reports and Summaries

Reports & Summaries

TTSE white logo
To facilitate the efficient mobilization and allocation of capital, fair and orderly secondary market trading in securities and the efficient clearing and settlement of transactions within a dynamic legal and regulatory framework that instills confidence in the integrity of the Exchange and related institutions.

Contact Info

10th Floor Nicholas Tower
63-65 Independence Square, Port of Spain,
Trinidad and Tobago
Business hours:
Mon – Fri: 8AM – 4PM

Phone number:
(868) 217–TTSE(8873)

Email: ttse@stockex.co.tt

Recent TTSE News

Advancing sustainable finance in Trinidad and Tobago

14/09/2026

West Indian Traders Limited (WIT) is now officially listed on the TTSE SME Market!

21/07/2026

TTSE and PwC Trinidad and Tobago Sign Memorandum of Understanding to Support SME Market Awareness and Capital Market Development

14/05/2026

Advancing Sustainable Finance in Trinidad & Tobao – Development of GSS+ Bond Issuance Guidelines

16/03/2026
Facebook-f Linkedin Instagram

© The Trinidad and Tobago Stock Exchange Limited 2025.

  • Home
  • History
  • Contact
  • Disclaimer

Live Summary Activity

Daily Liquidity Summary
Activity
Gainers
Decliners
Traded
Activity
Activity for 05 Nov 2026 as of: 12:05 PM
Symbol Volume
NEL 103,497
GKC 17,500
NFM 17,378

Top 3 stocks by Volume traded

Gainers
Activity for 05 Nov 2026 as of: 12:05 PM
Symbol Open Change Change %
AMCL $42.00 $3.00 7.14%
AGL $42.28 $2.36 5.58%
EHL $12.70 $0.05 0.39%

Top 3 stocks by price change %

Decliners
Activity for 05 Nov 2026 as of: 12:05 PM
Symbol Open Change Change %
GKC $3.70 $-0.48 -12.97%
TCL $1.99 $-0.24 -12.06%
ASBH $1.15 $-0.10 -8.70%

Bottom 3 stocks by price change %

Traded
Activity for the last five (5) trading days.
Symbol Volume Traded Days Traded % / 5 Days
SBTT 19,730 5 100.00%
JMMBGL 3,095 5 100.00%
NEL 17,980 5 100.00%

Top 3 stocks by % out of 5 trading days

Daily Liquidity Summary

Main Menu

Menu
  • Home
  • Investing
    • Subscriptions
      • Trading Reports
      • Trading System
    • Ready to Invest
    • Glossary of Investment Terms
  • Investor Education
  • SME Market
    • Listing Requirements
    • TTSE SME Market – Executive Guide
    • SME Mentorship Programme
      • SME Mentorship Programme
      • List Of SME Mentors
  • Rules
  • GSS+ Guidelines
  • Market Data
    • Indices
    • Reports & Summaries
    • Market Movement Report
  • Issuers
    • Listed Securities
    • Going Public
      • Listing your company on the TTSE
      • Listing on the First & Second Tier Markets
      • Listing on the Small & Medium Enterprise Markets
      • Listing on the Mutual Fund Markets
      • Listing on the Government & Corporate Bond Markets
      • Listing & Other Fees
      • Benefits of Listing
  • Media Centre
    • Newsroom
    • TTSE News
    • Events
    • Capital Markets Conference 2025
    • Capital Markets Conference 2024
    • Related Websites
    • Brochures
    • FAQ
    • COVID-19 Updates
    • Prospectus and Offer Circulars
    • Document Centre
  • Member Firms
    • Opening a Brokerage Account
    • Equities, Mutual Funds and Corporate Bonds
    • Government Bonds
    • CXN
  • Register
    • Trader Registration
    • Stockbroker Registration
    • Member Registration
    • Online Trading Registration
    • TTCD Portal
  • TTCD
    • About TTCD
    • TTCD Fees
    • Procedures
    • Euroclear Custody
    • Registrar Services
    • TTCD Bank Mandate
    • FATCA
    • Shareholders
    • TTCD Forms
  • About
    • History
    • Mission and Vision
    • Governance
    • Who We Are
    • Corporate Profile
    • Careers
    • Annual Reports
    • Trading
    • TTSE Fees
    • Contact
      • Feedback
Search

Summary Activity

Equities

Activity for 29 Sep 2026
Symbol Open Close Change Volume
RFHL $112.05 $113.01 0.96 23,924
FCGFH $40.09 $40.22 0.13 9,221
NGL $10.25 $10.34 0.09 20,885
NEL $4.51 $4.60 0.09 1,834
TCL $1.91 $1.99 0.08 20,191
UCL $15.19 $15.26 0.07 5,915
NFM $1.65 $1.70 0.05 28,731
SBTT $47.56 $47.60 0.04 600
OCM $1.67 $1.68 0.01 5,040
CIBC $7.99 $8.00 0.01 204,011
WCO $4.15 $4.15 0.00 6,778
MED $43.75 $43.75 0.00 1
ASBH $1.50 $1.50 0.00 167
NCBFG $2.95 $2.95 0.00 3
PHL $11.50 $11.50 0.00 5
PLD $7.50 $7.50 0.00 143
WIT $2.13 $2.13 0.00 20
GHL $16.60 $16.60 0.00 2,191
AHL $10.67 $10.67 0.00 109
AGL $48.45 $48.45 0.00 168
GKC $4.15 $4.15 0.00 2,345
JMMBGL $0.89 $0.88 -0.01 1,845
AMCL $45.00 $44.99 -0.01 634
MASSY $3.40 $3.39 -0.01 57,808
AMBL $28.25 $28.20 -0.05 695

Summary Activity

Bonds

Activity for 29-Sep-2026
Symbol Open Close Change Volume
J314 76.00 80.00 4.00 10000

Summary Activity

Mutual Funds

Activity for 29-Sep-2026
Symbol Open Close Change Volume
No Trade Activity.

Summary Activity

USD

Activity for 29-Sep-2026
Symbol Open Close Change Volumes
No Trade Activity.

CONFERENCE REGISTRATION FORM

“Leveraging Capital Markets to Enhance the Economic Potential of the Caribbean"

Step 1 of 3

33%
Company Address(Required)
Is mailing address different from above?(Required)

Mailing Address (if different from above)

Mailing Address

Company Contact for Conference

Name

Attendees

These are the persons who will be attending the Conference.
List(Required)
Name
Designation
Telephone
Fax
Mobile
Email